A brand miss should never reach an RCA. The signs were in your systems weeks earlier, just fragmented, lagged, and never in the same place at the same time.
Last quarter, NBRx dipped on your lead brand. The monthly review did its job. Someone traced the drop to a prior-authorization (PA) change at a key payer, actions were assigned, and the team moved on.
The analysis was right. But look at the timeline: the cause had been visible for six weeks. The question worth asking is not what caused the miss, but why it ever needed an RCA to find out.
A miss, pillar by pillar
Market access: where the cause starts
Marketing effectiveness: where the confusion shows up
Sales effectiveness: where the field feels it
Commercial operations: where it becomes visible, too late
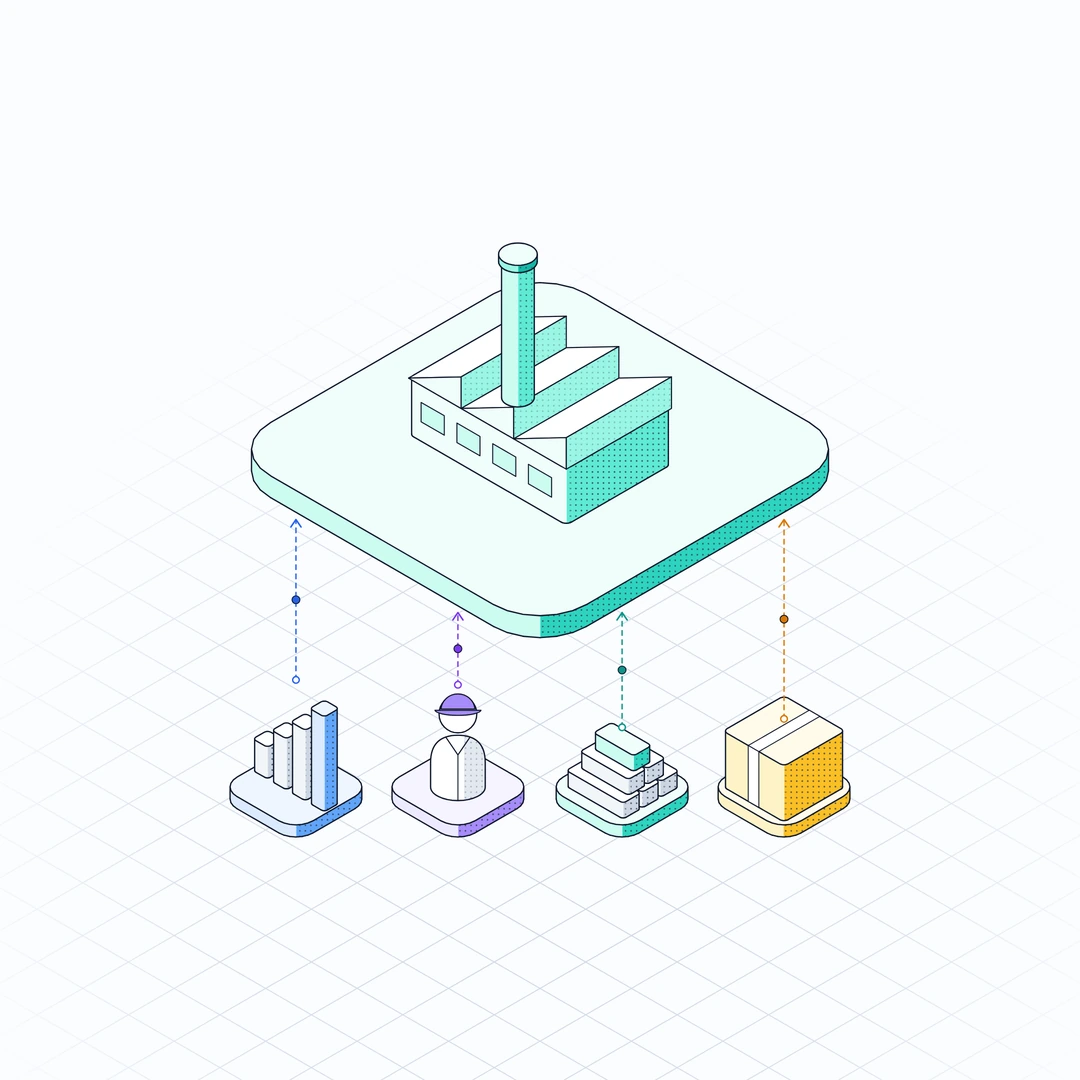
Six systems each held a fragment, and each pillar read its fragment as its own problem: a payer change, creative fatigue, a motivation issue, a lagging KPI. The likely fixes were wrong ones, a creative refresh and more calls, when the real need was access support.
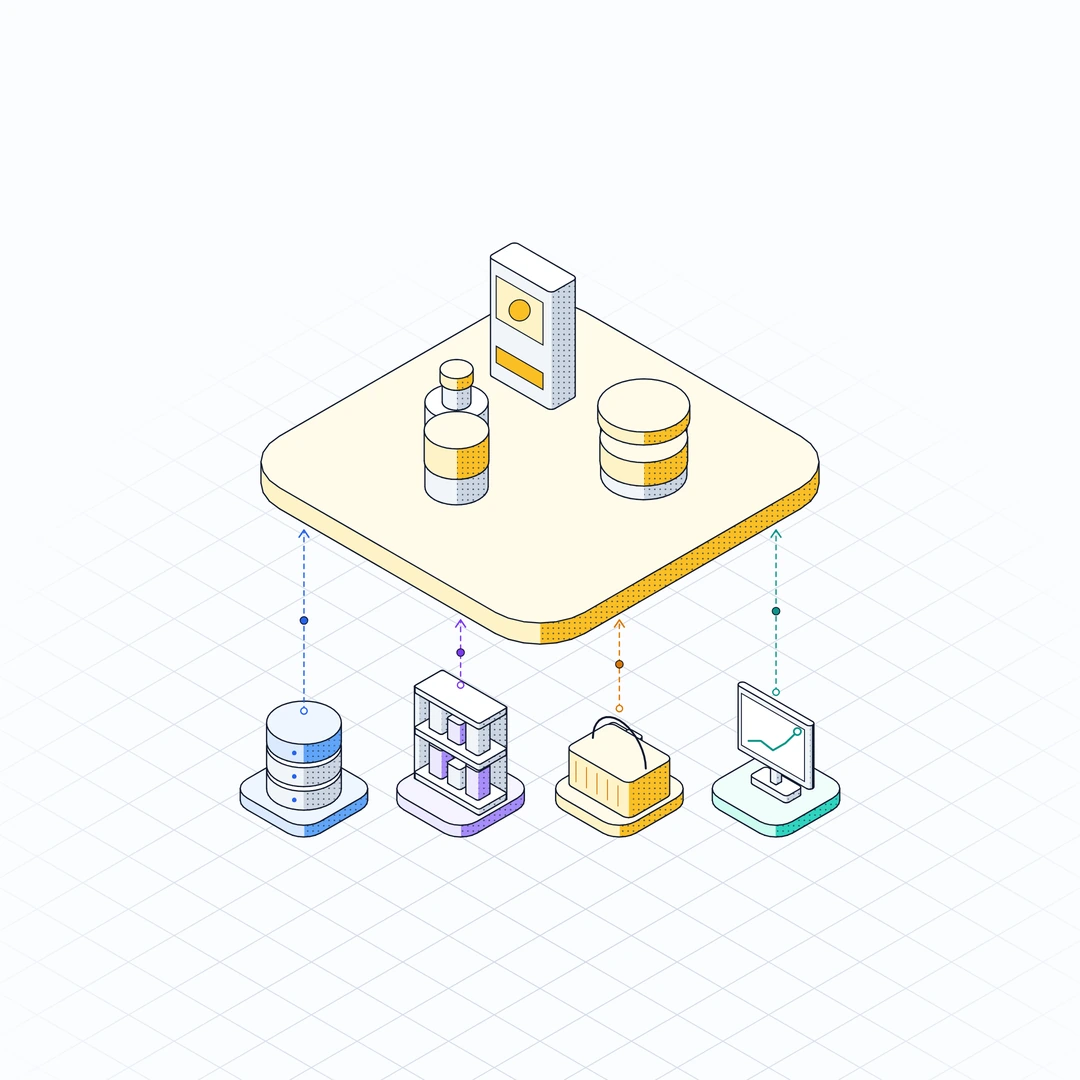
1. Fragmented by design. Access trackers, hub, digital engagement, CRM, MDM, and claims were bought at different times, for different functions, from different vendors, each with its own owner and definitions. Nobody designed the gaps. They are what you get when every function optimizes its own tool.
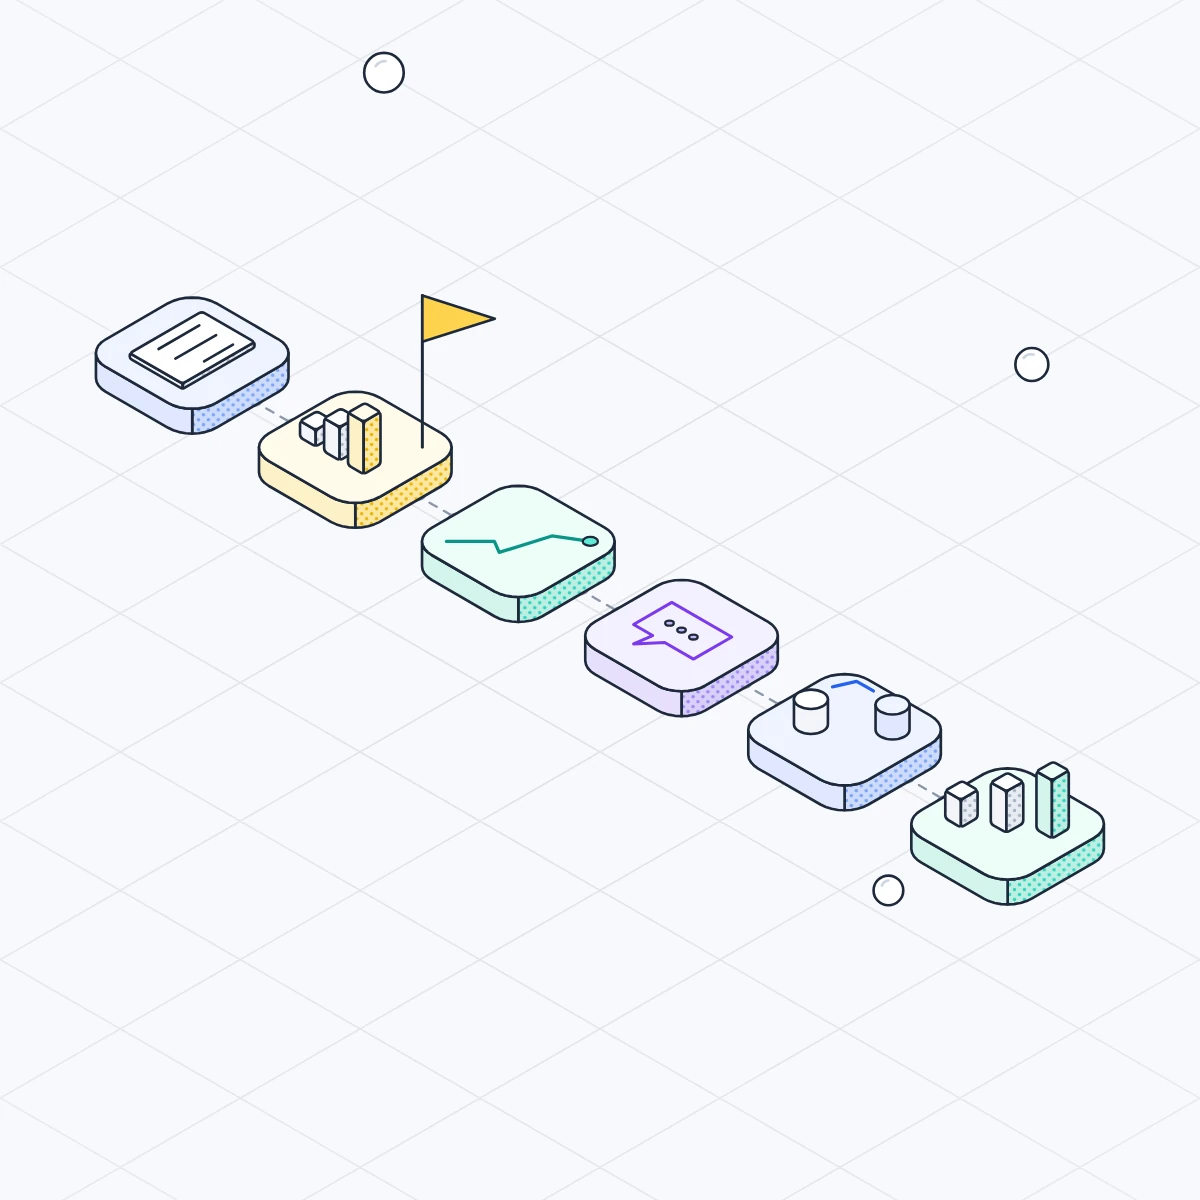
2. Cause and effect sit at a lag in each system. You rarely own your transaction data. Claims, specialty pharmacy, and hub feeds arrive weeks after the event, each at its own pace. A cause appears in one system in week 1, an effect in another in week 2, and the KPI in week 6. At any moment, the picture is incomplete.
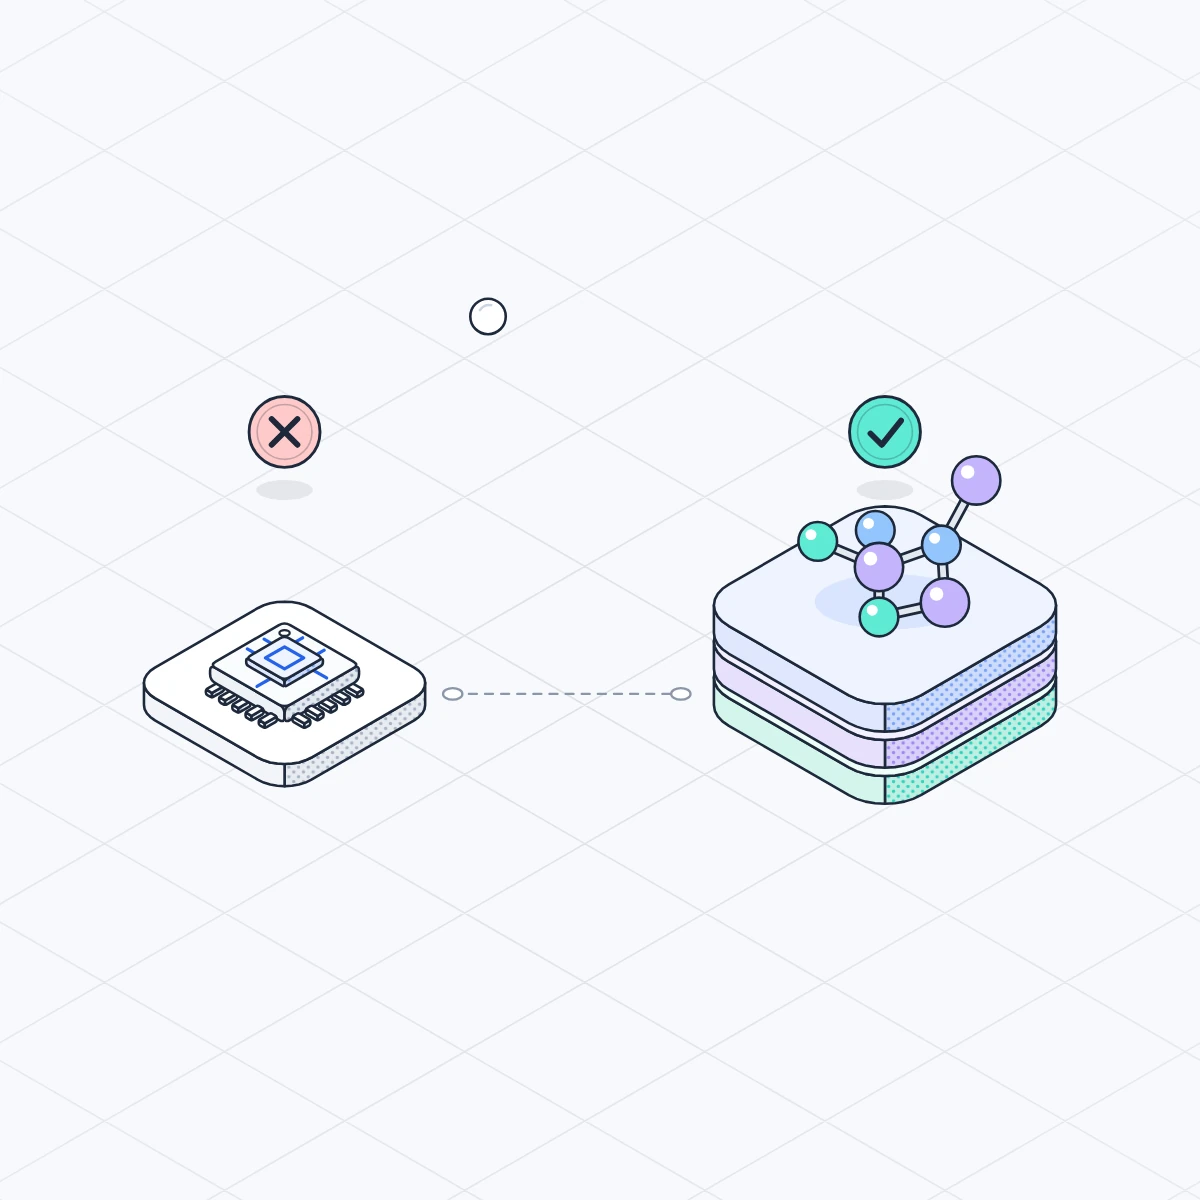
3. The combinations are too many to watch. Take a modest brand: a dozen payers with their own tiers and PA rules, hundreds of HCOs, thousands of HCPs, several channels, multiple field roles, and country rules. A fault can start at any intersection and surface across several systems. No analyst can manually watch every combination every week. That is not an effort problem, it is a combinatorial one.
Three reasons it keeps happening
1Fragmented by design
Access tracker
Owner
Access
Definition
Payer, coverage, formulary
Hub
Owner
Patient Services
Definition
Patient enrolment, services
Digital
Owner
Marketing
Definition
Content, traffic, engagement
CRM
Owner
Sales Ops
Definition
HCP interactions, activities
MDM
Owner
Data
Definition
HCP, HCO, product master
Claims
Owner
Analytics
Definition
Prescriptions, NBRx, TRx, rebates
2Cause and effect at a lag
3Too many combinations
Illustrative mid-size brand. Checked weekly, by hand, impossible.
The irony is that the evidence is rarely missing. Almost every miss leaves a trail upstream, weeks before the KPI moves: a bulletin, a rejection rate, a content spike, a call note, a referral shift. Each is weak alone, and each sits in a different system at a different lag.
Our point of view: root cause analysis is never wrong. It is always late.
Each miss triggers a careful RCA. It finds a real cause, and the fix addresses that specific fault. But the next miss arrives through a different combination: another payer, another HCO, another mix of systems. You were ready for the last failure, not this one.
So the problem is not the analysis. It is that the analysis is a post-mortem, run after the damage, on a fault that won't repeat in the same form. You will keep doing it every quarter because nothing has changed about how faults are found.
That is the RCA nobody should have to do. Not because analysis is wasteful, but because the cause should have reached you while there was still time to act.
The next fault point or an early signal of a Brand miss can be any of the combinations arising from multiple systems at variable lags, not necessarily what your RCA suggested.
More dashboards help, but each reports its own system well. The hub view shows rejections, the CRM shows notes, the campaign report shows engagement, and the claims view shows NBRx. None knows that the payer bulletin, the HCO with rising rejections, and the territory where your rep wrote that note are the same story.
Alerts also fire on single metrics. In pharma, causes arrive as weak, scattered clues that only mean something together.
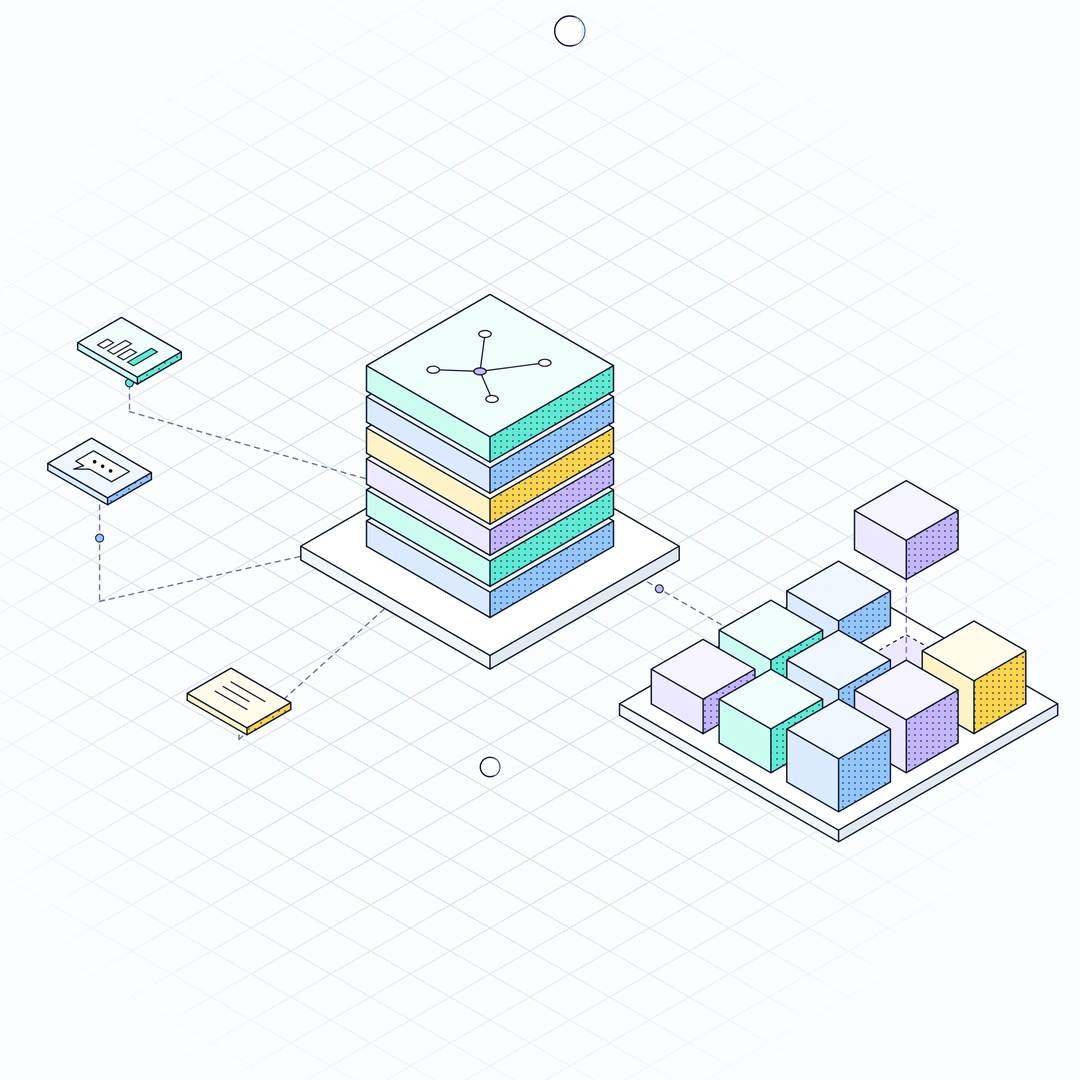
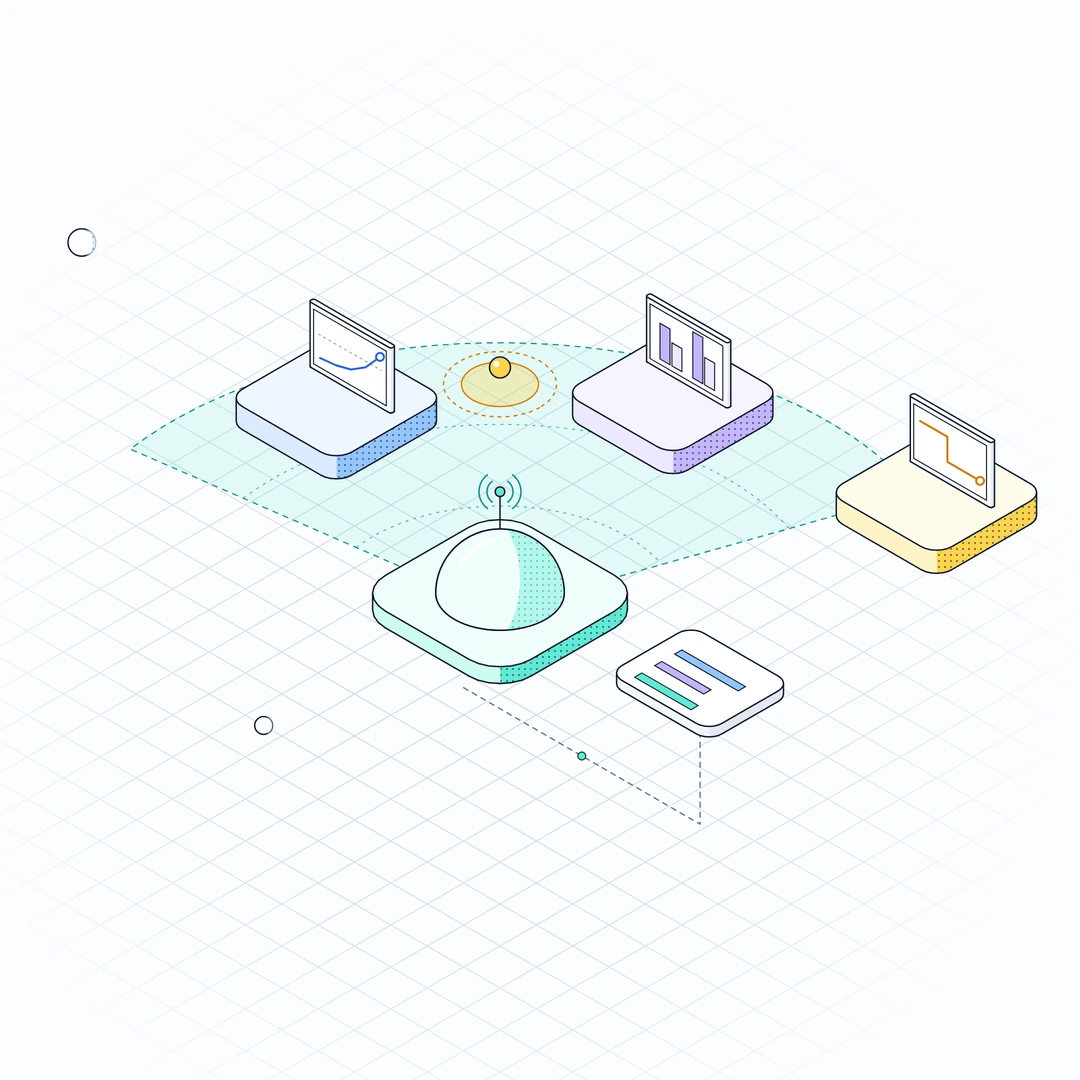
What's missing is a layer that understands how your commercial world connects and reasons across it continuously. We call it the commercial excellence brain. It has three parts.
A shared ontology: the map.
It links payer, formulary, product, HCO, HCP, patient flow, field role, and channel in one model, with shared definitions for what an NBRx, a call, or a reach means. It carries pharma's rules too: consent, approved content, permitted interactions, and country limits. A payer bulletin stops being an isolated document and becomes an event tied to specific accounts, prescribers, and territories.
Causal reasoning: the why.
Correlation says two things moved together. A causal model captures how things drive one another: a PA change leads to rejections, to abandonment, to referral shifts, to lost prescriptions. That lets the brain explain a signal, not just flag it, and estimate what an intervention is likely to change.
Self-learning: the memory.
Every signal, action, and outcome feeds back in: which interventions worked for which type of payer change, in which kind of account, in which country. The brain gets better at spotting combinations you have never seen, which is exactly what the third problem demands. Your people stay in control, because every recommendation comes with reasoning they can challenge and correct.
Three things made this practical. Modern platforms can bring the six systems into one governed layer without replacing any of them. Checking every combination of payer, HCO, HCP, and channel is routine for a machine. And with compliance rules built into the ontology, recommendations stay within what is permitted.
Around the clock, the brain does six things:
The commercial excellence brain
Market accessLag: 0-1w
Payer policies, coverage, formulary changes
HubLag: 1-2w
Patient enrollment, services, support
Specialty pharmacyLag: 2-3w
Prescription fill, abandonment, adherence
DigitalLag: Real time
Content traffic, search, engagement
CRMLag: 1w
HCP and account activity, calls, messages
MDMLag: 1-2w
HCO, HCP, product, territory master
ClaimsLag: 4-6w
NBRx, TRx, refills, patient journeys
Shared ontology the map
Payer · HCO · Product · HCP · Channel · Territory
Causal reasoning the why
PA change → rejections → abandonment → referral shift → lost Rx
Self-learning the memory
Incorporate outcomes · Refine models · Get better over time
Market access →
Engage payer, support affected accounts
Marketing →
Shift content to PA support
Sales →
Change the ask, add MSL support
Commercial ops →
Flag referral shift, refresh targets
The output is not an alert. It is an early warning with an action for each pillar:
Run the same scenario again.
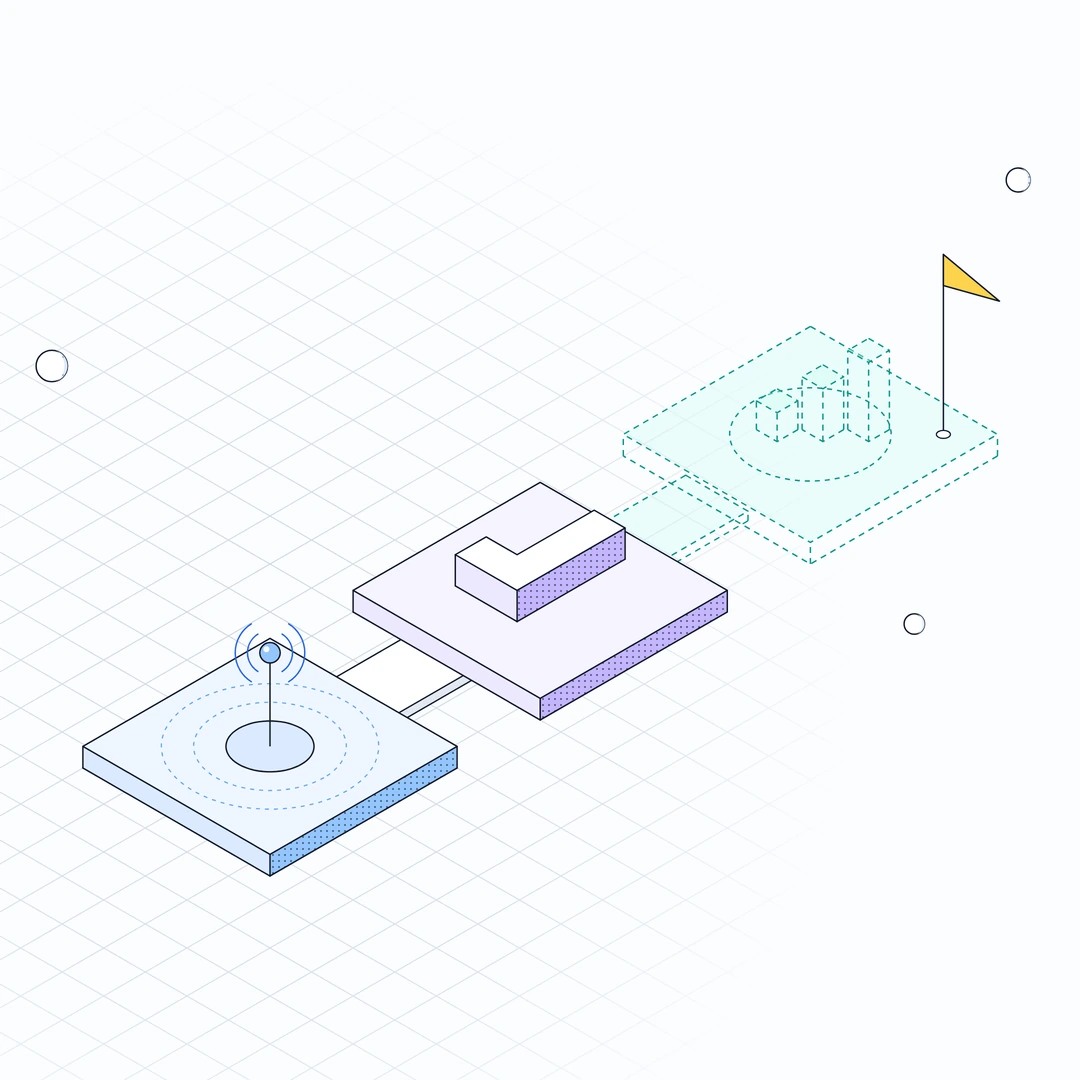
In week 1, the bulletin lands and the brain maps it to the accounts and prescribers it touches. In week 2, rising rejections and the access-content spike match the pattern, and an early warning fires with the likely cause and an action for each pillar. Access engages the payer. Marketing moves content to PA support. The rep knows what help to offer and what not to push. Ops refreshes the target list before the referral shift spreads.
By week 6, when claims would have shown the drop, the response is weeks old. The review still happens, but it confirms rather than discovers.
Misses will still happen. What changes is when you learn about them, and whether anyone is left doing the RCA nobody should have to do.
A question for your next brand review
Which of your six systems saw it first, and who was told?
Because the evidence sits in six systems, each with its own owner, definitions and time lag. In a typical prior-authorization miss, the payer bulletin appears in week 1, PA rejections rise in week 2, access-content traffic and rep notes follow, and NBRx only drops in week 6 when claims land. Each pillar reads its fragment as its own problem: a payer change, creative fatigue, a motivation issue, a lagging KPI. The cause only becomes clear in the review after the KPI has moved.
Each dashboard reports its own system well, but none knows that the payer bulletin, the HCO with rising rejections and the rep's call note are the same story. Alerts fire on single metrics, while in pharma causes arrive as weak, scattered clues that only mean something together. Even an illustrative mid-size brand has about 130 million combinations of payers, HCOs, HCPs, channels and field roles, which no analyst can check by hand every week.
It is a layer that understands how your commercial world connects and reasons across it continuously. It has three parts: a shared ontology that links payer, formulary, product, HCO, HCP, patient flow, field role and channel; causal reasoning that captures how a PA change leads to rejections, abandonment, referral shifts and lost prescriptions; and self-learning that feeds every signal, action and outcome back in. Its output is not an alert, but an early warning with an action for each pillar.